Home / Forex news / Do 10-Years Have What It Takes to Reach 2.00%?
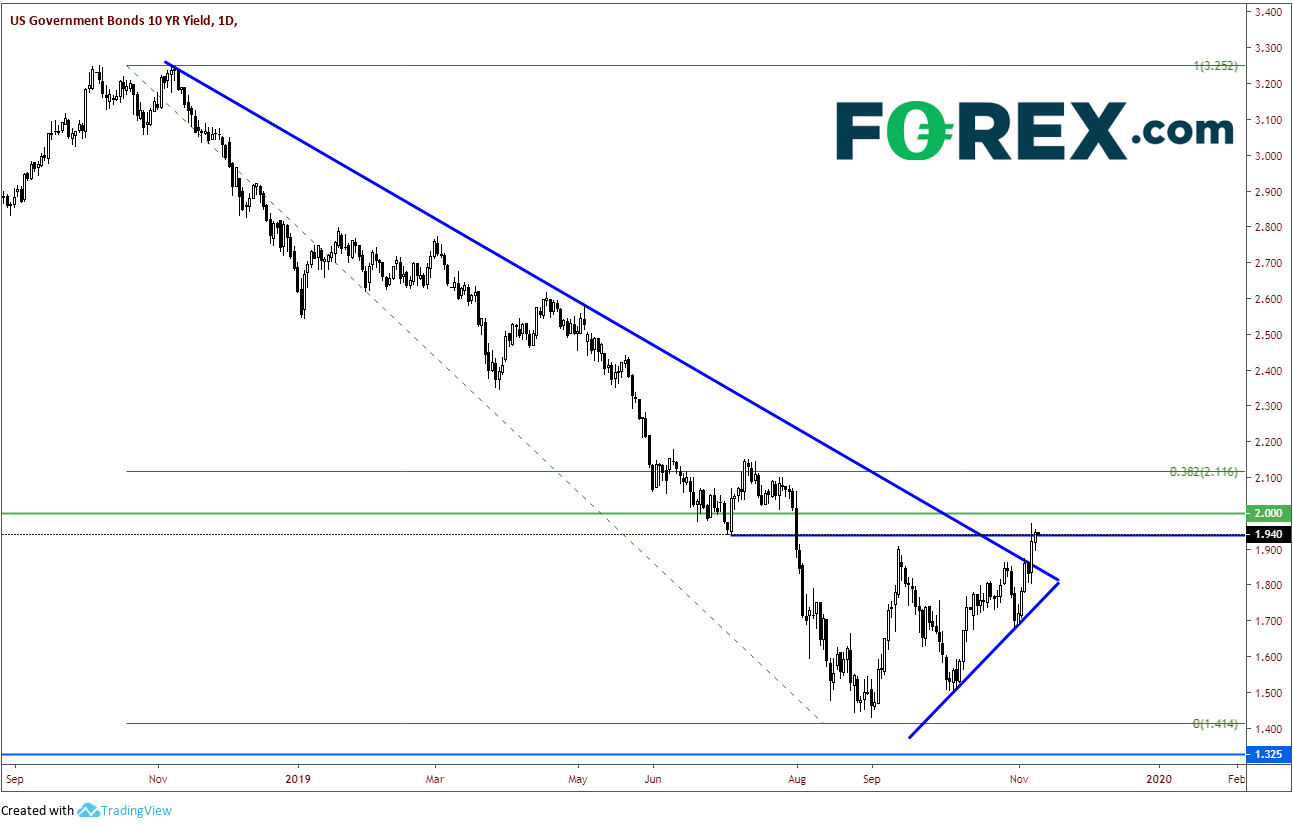
The US bond market is closed today in recognition of Veteran’s Day, so this is a good time to take a look at yields and try and determine where they may be headed next. The Fed is on hold (so they say). Stocks are near all time highs. The way we have been taught is that when stocks go higher, bonds go lower. And if bonds go lower, that means yields go higher, right? Here is the 10-year yield, sitting just below the all important 2.00% level, at 1.94%. Why is this level so important? Theoretically, its not, but the market uses it as an important psychological level. Therefore, because “the market” pays attention to it, we must too.
On Thursday last week, 10-year yields broke above a year long (almost to the day) downward sloping trendline and on Friday closed right at previous lows (horizontal resistance) from early July. If yields can move 1.972, Thursday’s high, next stop is 2.00%. Above that resistance (in yields) would be at the 38.2% retracement level from the November highs last year to the September 3rd lows of this year at 2.116%.
Source: Tradingview, FOREX.com
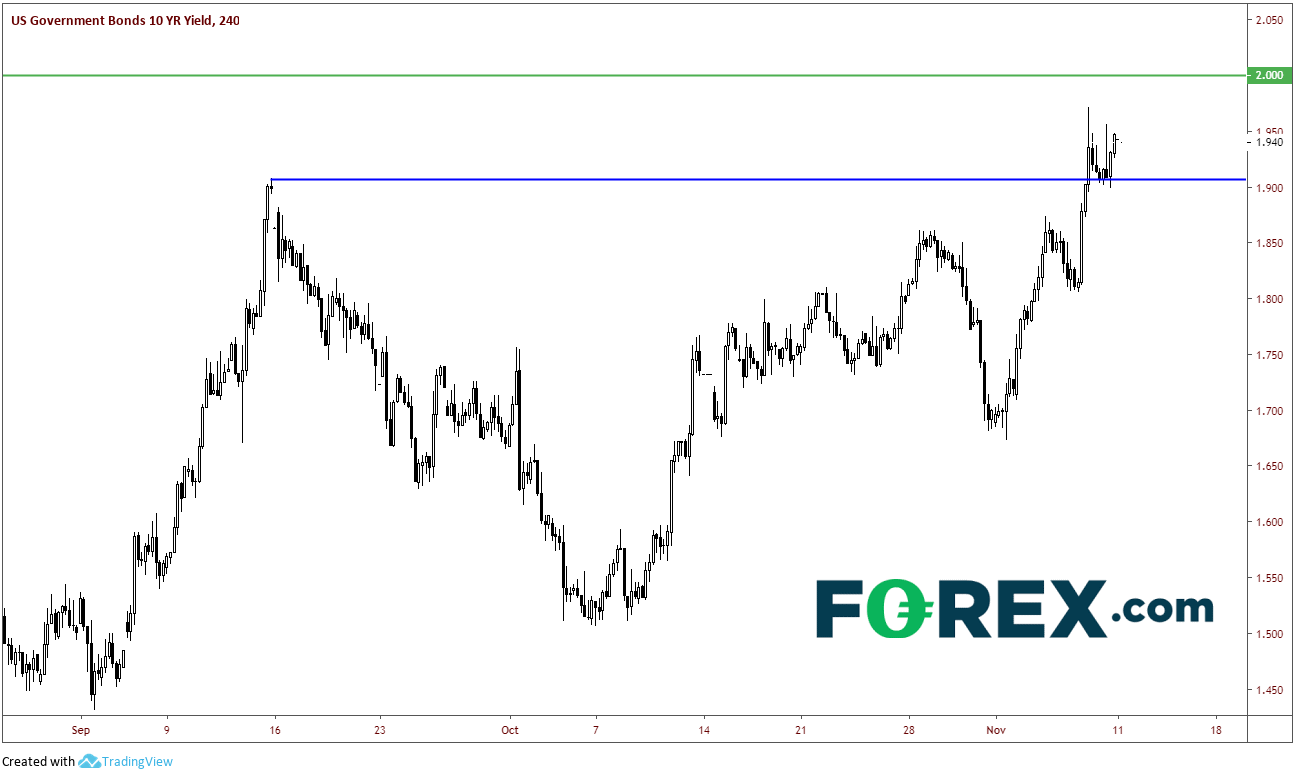
On a 240-minute chart, we can see clearly how yields broke about the highs from September 13th and pulled back to retest those levels. Yields failed to take out support and pushed higher into the close on Friday.
Source: Tradingview, FOREX.com
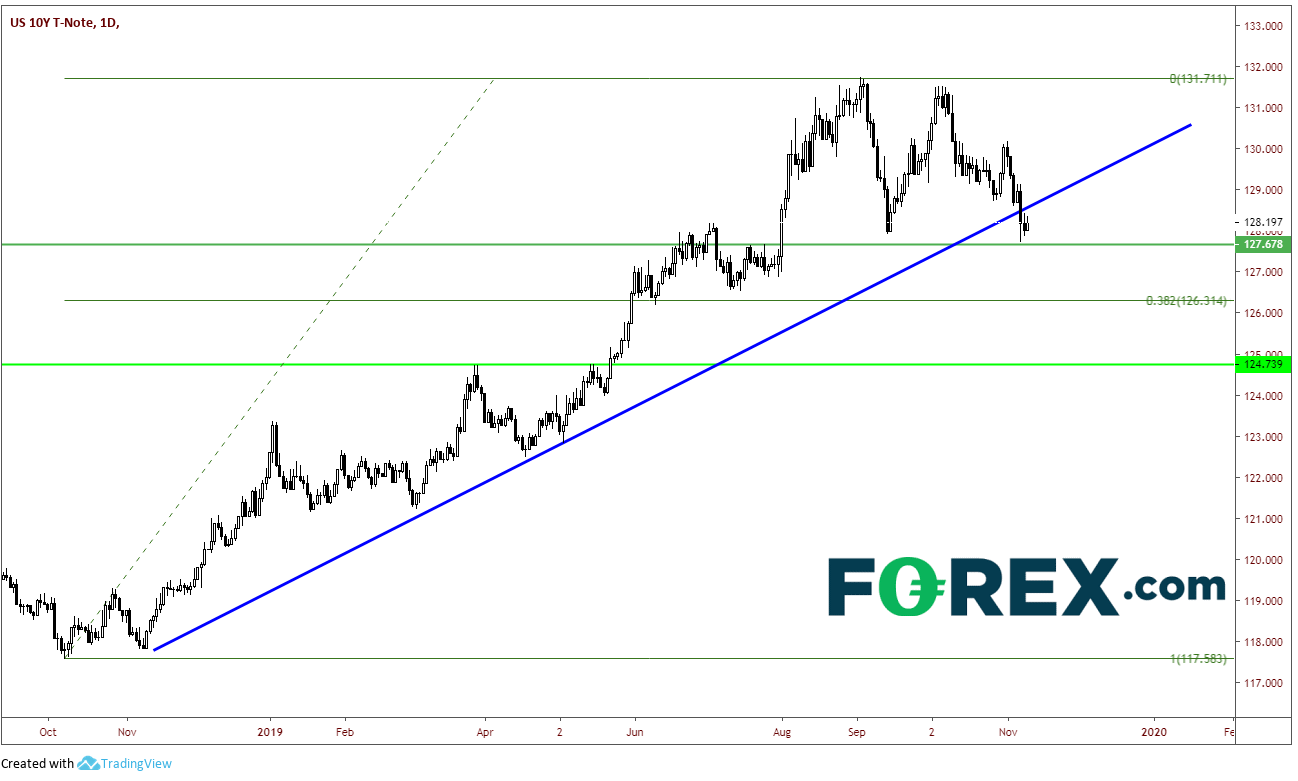
On a daily price chart of the 10-year, price traded lower off the highs and ran into horizonal support at 127.678 (since this is the cash market, we will not quote it in 32nds). If price pushes below this level, it will correspond with 2.00% in yields. Next support for price would be at the 38.2% retracement level from the low on October 10th, 2018 to the highs on September 2nd of this year at 126.314. Resistance is back at the upward sloping trendline, near 189.594.
Source: Tradingview, FOREX.com
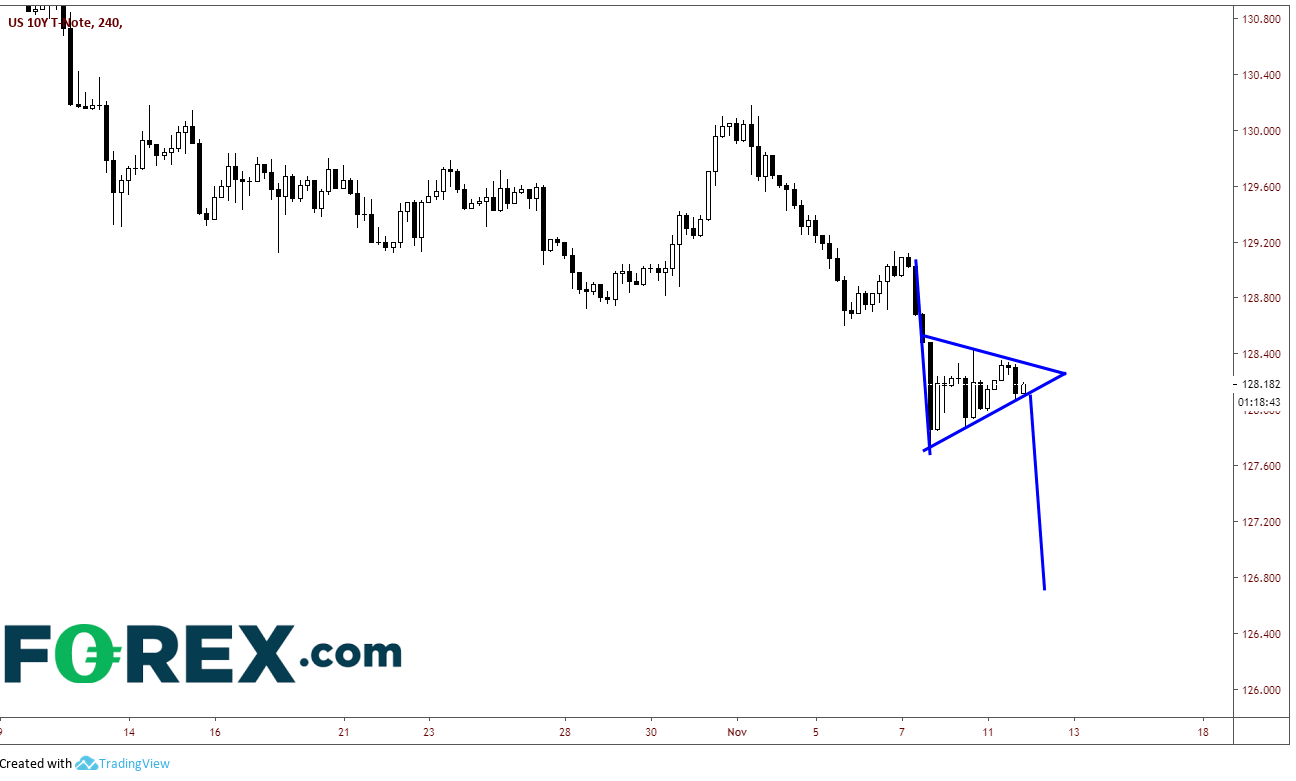
On a 240-minute price chart, price has formed a symmetrical triangle. Symmetrical triangles typically trade in the same direction as the previous trend, which in this case would be lower. If price breaks lower from current levels, the target would be 126.692, slightly above the 38.2% retracement on the daily. If price were to trade down to these levels, that should put yields somewhere in the 2.10% area.
Source: Tradingview, FOREX.com
Will 10-year yields get above 2.00%? The stock market is open today and the S&P 500 is down about 6 handles at 3085. If stocks were to remain around these levels, 10-year yields could open unchanged to slightly lower Tuesday morning. But watch for a push towards the 2.00% level, as bulls (price bears) will want to test stops above that level.
Original from: www.forex.com
No Comments on “Do 10-Years Have What It Takes to Reach 2.00%?”