Home / Forex news / DXY Giving Mixed Signals

Earlier today, the Financial Times reported that US officials are considering removing tariffs on $112 billion in Chinese goods as a concession to seal Phase One of the trade deal. Also, the China Global Times tweeted that in order to reach a deal, China and the US must simultaneously remove existing tariffs at the same ratio, which means that tariffs to be removed should be in proportion to how much agreement has been reached. The main takeaway from these headlines and stories is that things are happening. Officials are talking. Progress is being made. As a result, the US Dollar Index is bid, currently up .35% on the day. As my colleague Fawad points out, it’s currently a day to buy US Dollars, and sell fixed income and gold. (However, also as Fawad point out, just one tweet from President Trump can reverse everything!)
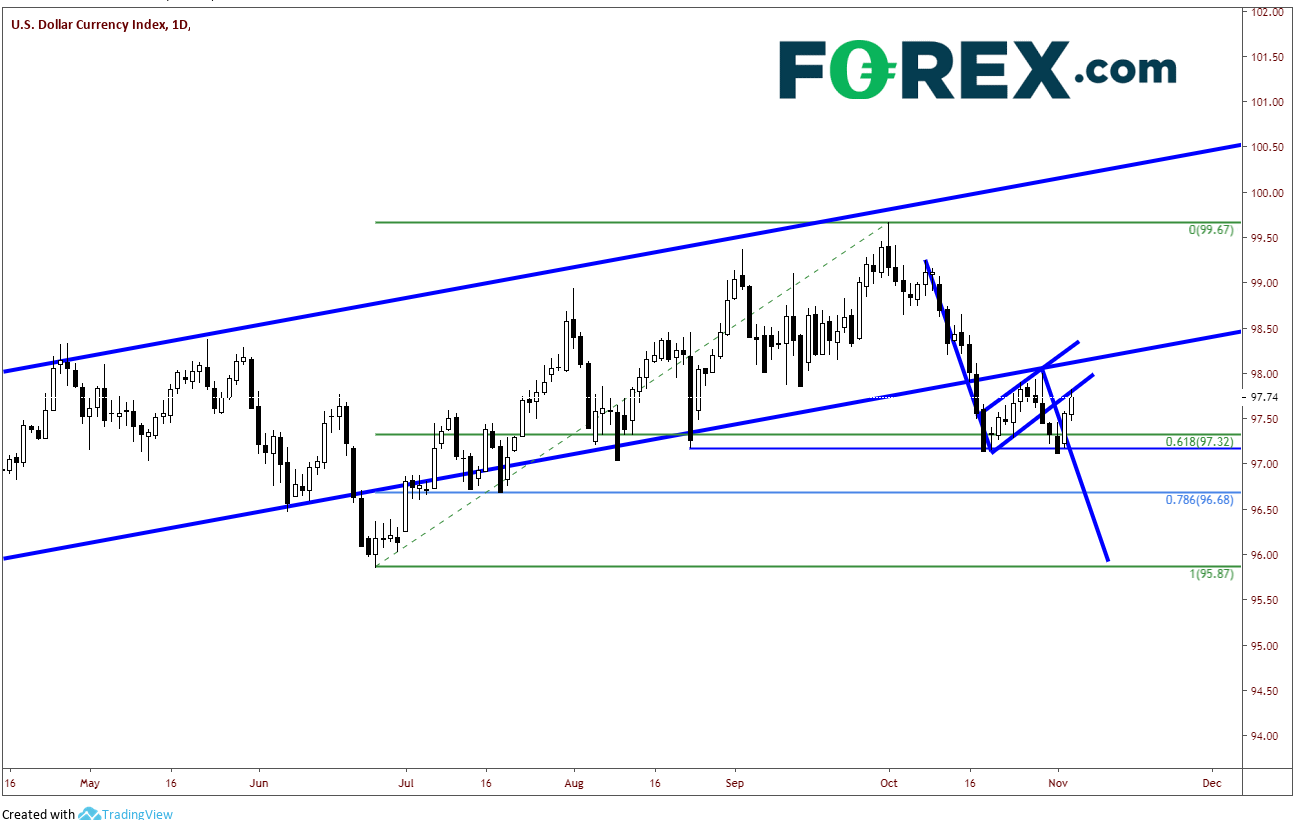
With the US Dollar Index on the move today, the DXY charts are giving mixed signals. On the daily chart, the market appeared to be setting up for a nice bearish flag formation, targeting 96.00. However, price has bounced from support and is currently testing the bottom trendline of the flag formation. The bearish flag pattern is still in place for now. However, a move back into the pattern, near 98.00, would negate it.

Source: Tradingview, FOREX.com
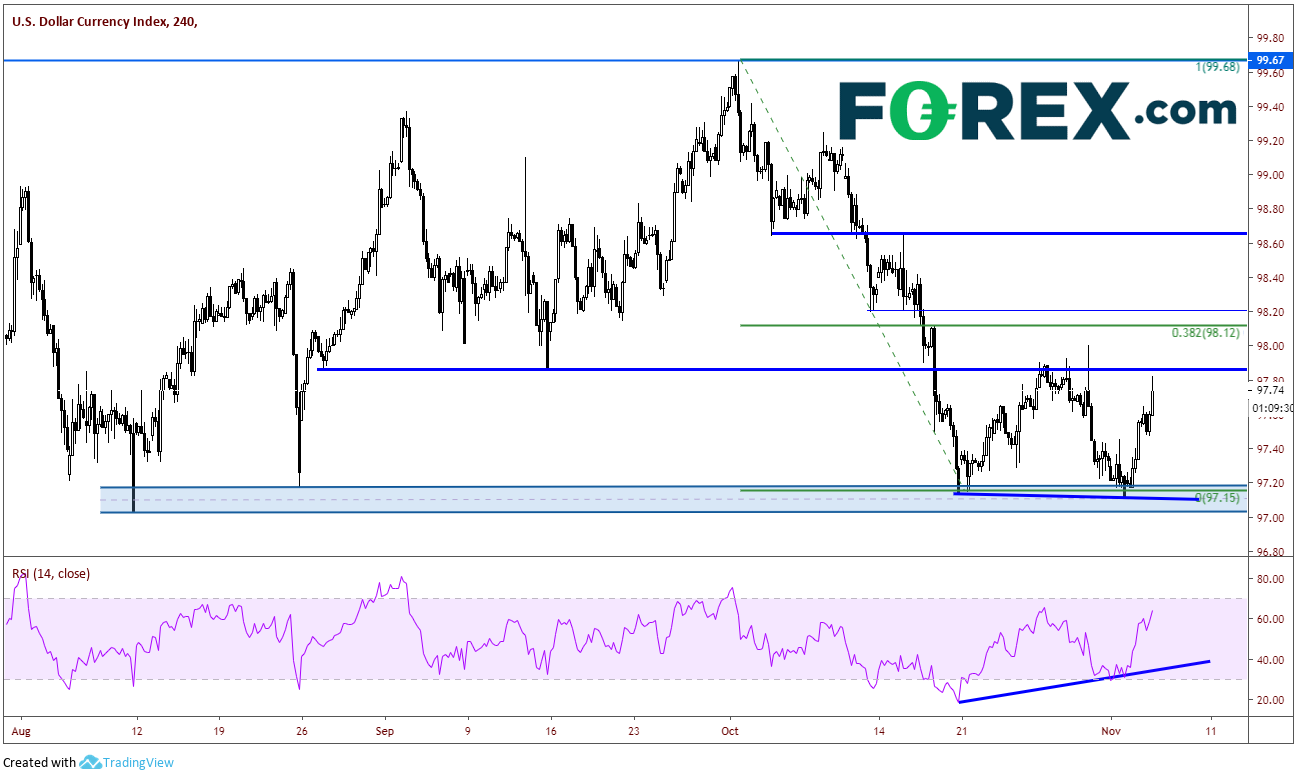
On a 240-minute chart, the US Dollar Index has put in a double bottom in a support zone with price and RSI diverging. Technically, it would not be considered a double bottom chart formation until it breaks the neckline near 98.00. However, there is no doubt that DXY has held the support zone two times.

Source: Tradingview, FOREX.com
This puts a resistance zone between 97.90 and 98.00. If price breaks through there, the flag pattern will be negated, and the double bottom will in play. The target for a double bottom is the height of the pattern added to the breakout out area, which in this case would be near the horizonal resistance at 98.60. However, there is a rising long-term trendline where price must break through first near 98.15. There is small horizontal support near 97.50, but the bigger support is the double bottom support zone between 97.00 and 97.15. On a daily chart, one can see this is also the 61.8% retracement level from the lows on June 25th to the highs on October 1st.
Make sure to pay attention to the 97.90/98.00 level. This may be the bull/bear line for US Dollar Index traders.
(As of the time of publish, DXY is trading right at 97.88)
Original from: www.forex.com
No Comments on “DXY Giving Mixed Signals”