Home / Forex news / DXY Strong Despite Appetite for Risk

Many times, when there is a risk on move, such as the one we saw this week in equities, there is a belief that the US Dollar should be moving lower. And many times, that is the case as we often see EUR/USD and the S&P 500 move together. But it’s not always true. Today, we see S&Ps and the DYX moving higher together, while foreign currencies are moving lower.
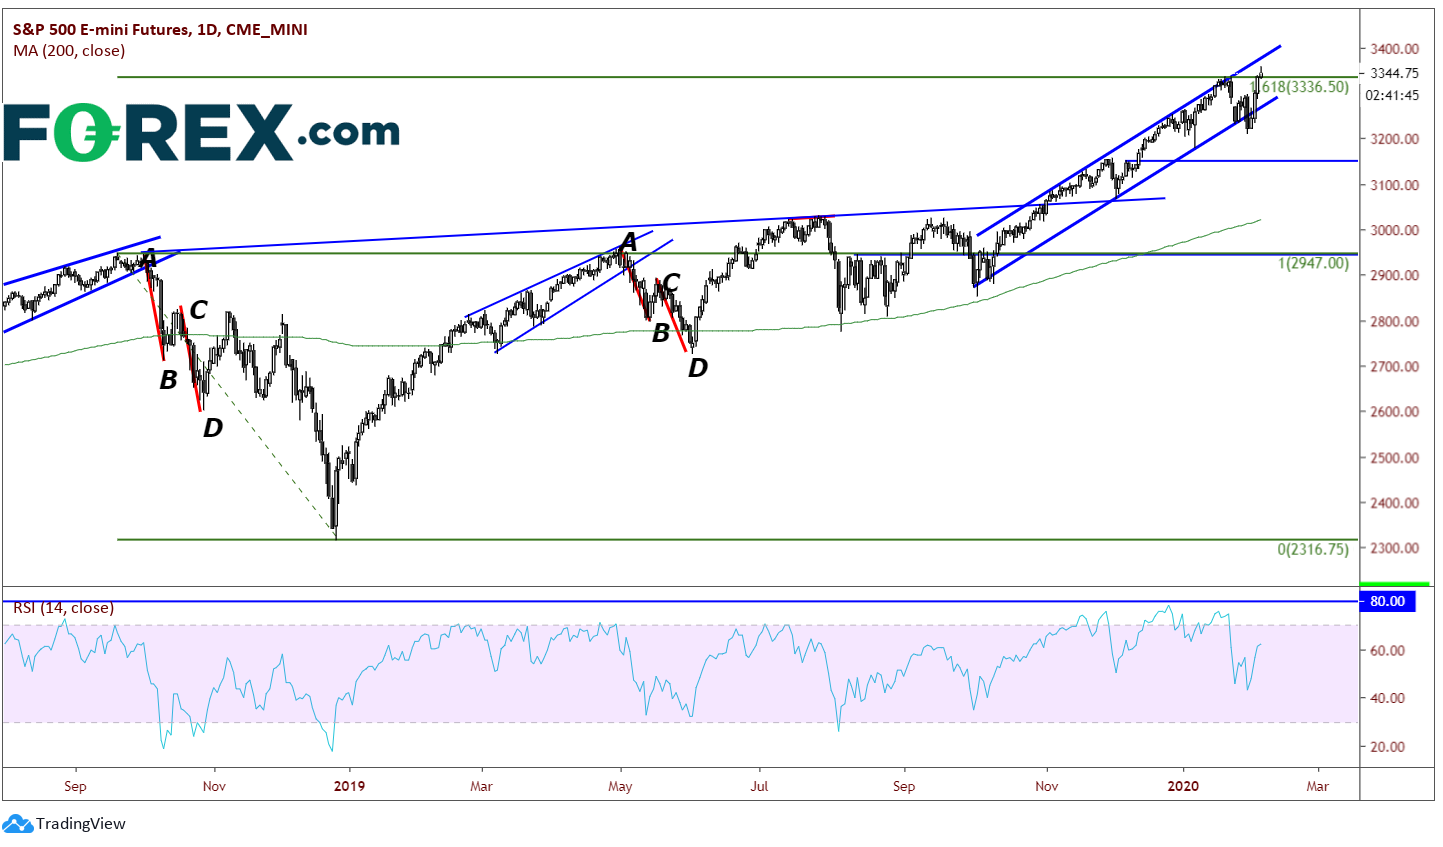
S&P 500 futures have put in an all-time new high today at 3357.75! The new high comes despite continued risks that the coronavirus may continue to spread, however with hopes that a new vaccine may be found soon. The futures index has put in a shoot start candle, an indication that price may be ready to reverse. The reversal candle comes just above the 161.8% Fibonacci extension from the highs on September 21st, 2018 to the lows on December 24th of that same year. This is considered the “Golden Fib” level, as should not be ignored as resistance.

Source: Tradingview, CME, FOREX.com
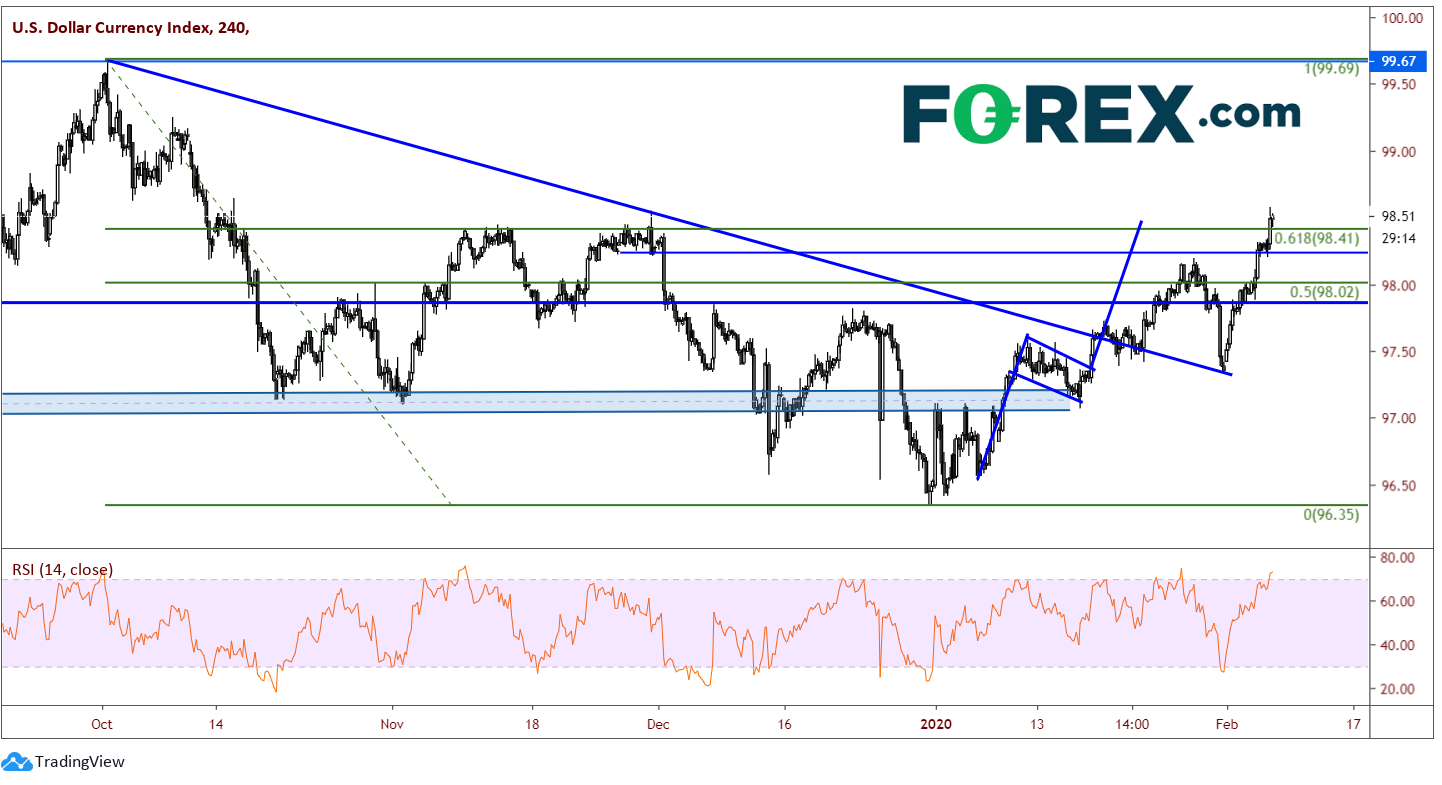
With that in mind, perhaps it is the DXY that is leading the way for stocks. As the US Dollar index continues to move higher, stocks have pulled back on the day. On a 240-minute time frame, although the DXY has met its target from the flag formation in January, it has also broken through the 61.8% Fibonacci retracement level from the highs on October 1st, 2019 to the lows on December 31st. If price closes about 98.40, look for a possible run to the October highs at 99.67, especially if stocks pull back. However, caution that the RSI is in overbought territory and price may be ready for a pause.

Source: Tradingview, FOREX.com
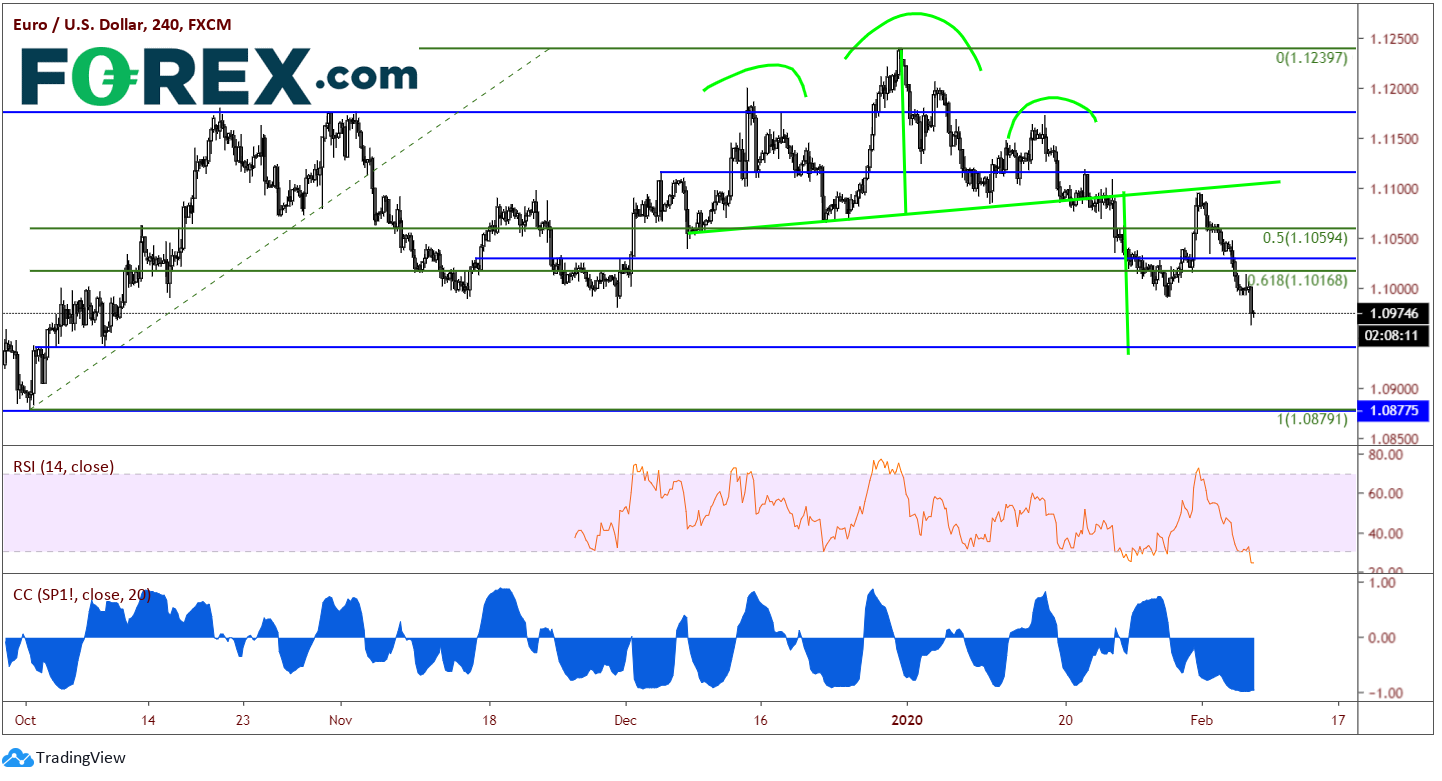
In addition, EUR/USD is also moving lower (US Dollar higher). The pair recently tested the neckline of the head and shoulders formation and is headed towards the target level near 1.0935. This level also coincides with horizontal support. Note here that the RSI is in oversold territory and EUR/USD may be ready to pause as well. At the bottom of the chart, notice to correlation coefficient between the S&P 500 and EUR/USD. It is currently -.97, which means the two assets are currently trading at almost a complete inverse of each other. Also notice though how at other times, the correlation is near +1.00, which means they trade together 100% of the time.

Source: Tradingview, FOREX.com
Tomorrow, the US releases Non-Farm Payroll data. Given the strong ADP data released yesterday, the surprise would be a worse than expected number. Traders need to consider what a better or worse than expected number will mean for stocks and the US Dollar, given that they are trading together now. Will this data cause them to decouple? Or could the underlying coronavirus theme keep them moving together?
Original from: www.forex.com
No Comments on “DXY Strong Despite Appetite for Risk”