Home / Forex news / Is the USD/SEK – DXY Correlation Broken?

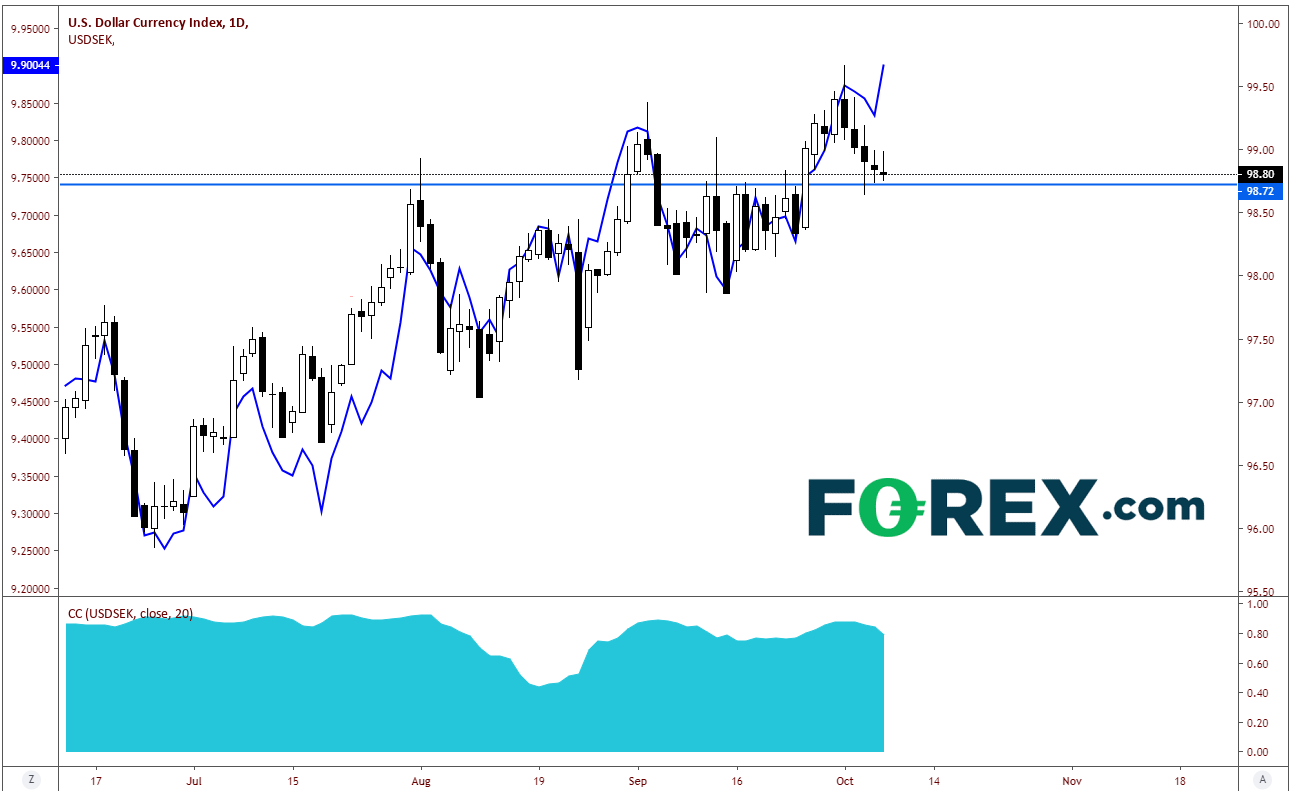
USD/SEK and DXY often move in the same direction. USD/SEK is often used as a proxy for the US Dollar Index for those who don’t have access to trade DXY. As a matter of fact, since mid-June the correlation coefficient on a daily timeframe for the two instruments been positive (meaning the 2 always move in the same direction), and the lowest readying since that date was +.46. However, today’s price action shows the 2 instruments diverging as the DXY is lower on the day and USD/SEK is higher.

Source: Tradingview, FOREX.COM
If this correlation is to continue, there needs to be some type of mean reversion in order for the USD/SEK to line up again (so they can move together). Either the USD/SEK has to pull back or the DXY has to move higher, or a little of both.
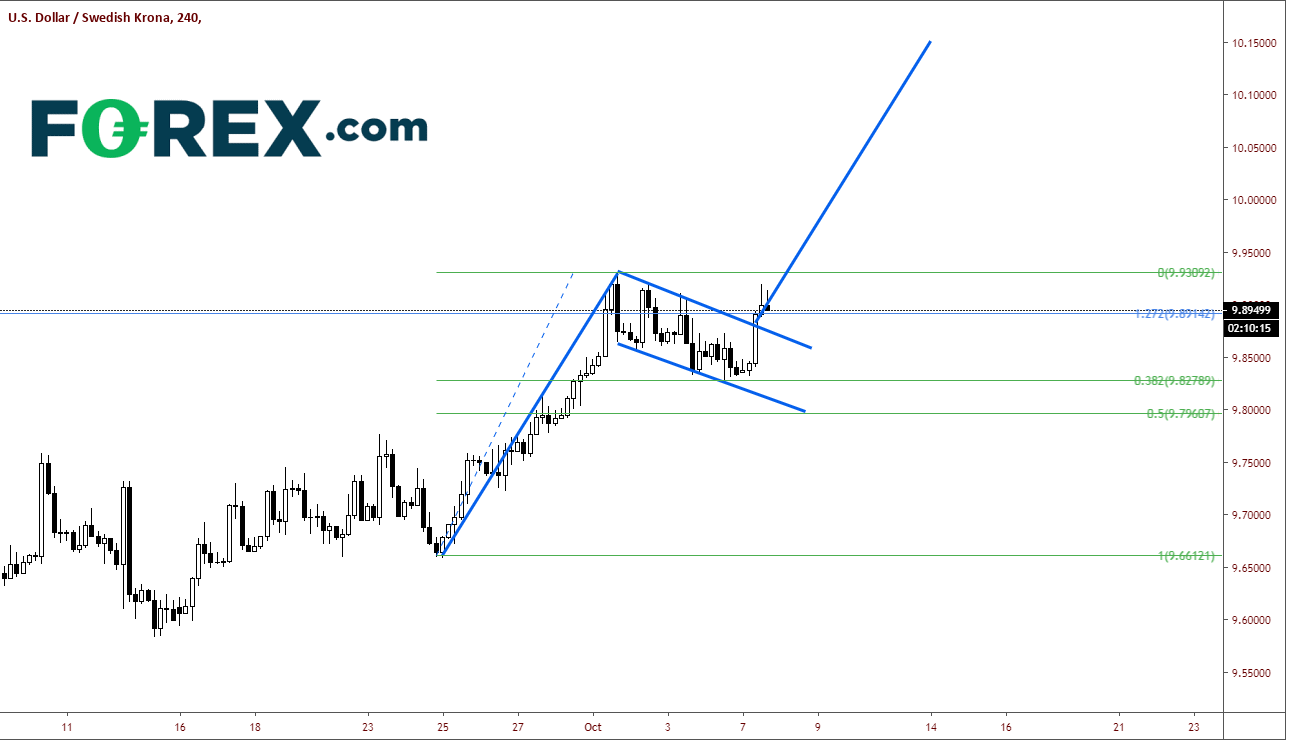
On a 240-minute timeframe, USD/SEK has broken out a flag pattern as prices could only pull back to the 38.2% Fibonacci retracement level from the low on September 24th to the highs on October 1st. The target of a flag pattern is the distance of the flagpole added to the breakout point of the flag. In this case the target is near 10.1500. However, price doesn’t always move in a straight line and the current candle is putting in an inverted hammer (reversal indication). This may mean price could pull back and test the downward sloping trending of the flag which is at 9.8756.

Source: Tradingview, FOREX.COM
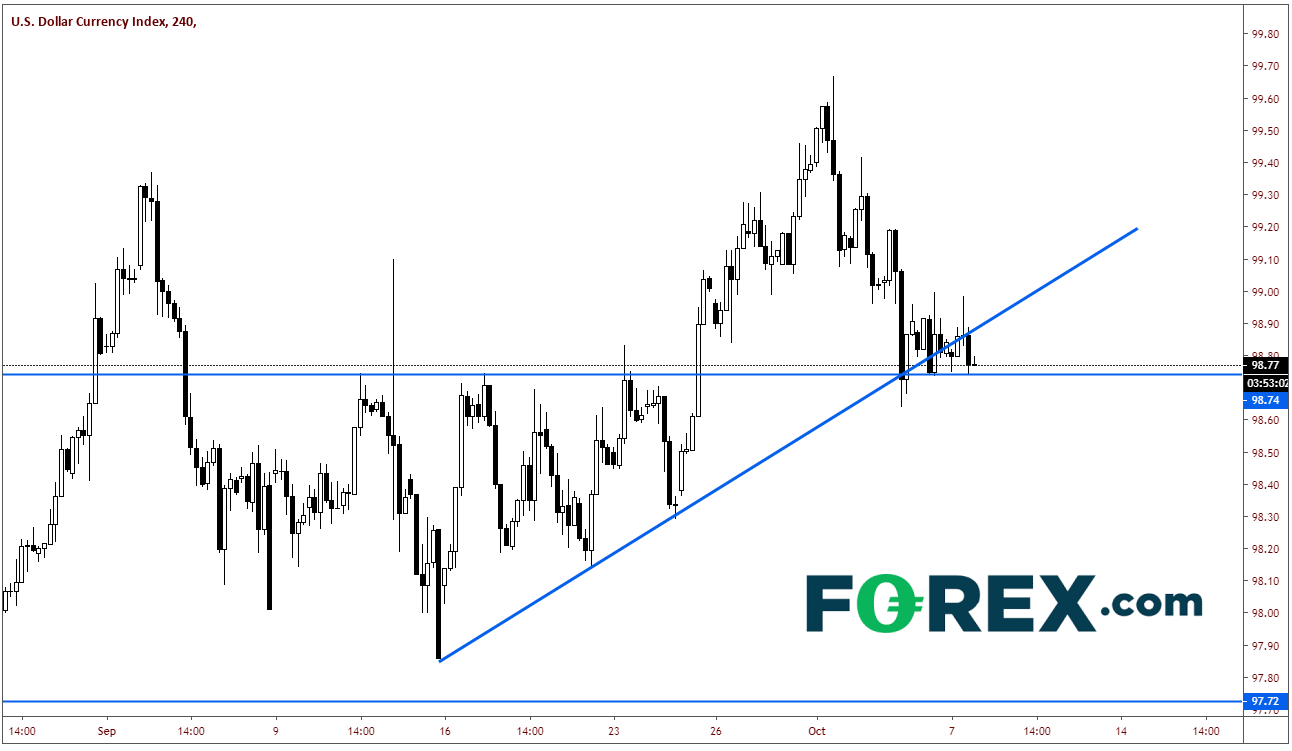
As far as DXY is concerned, on a 240-minute timeframe price has pulled back off the recent highs and is currently testing horizontal resistance near 98.74. Ideally, this price should hold and bounce back above the rising trendline towards 99.20 if USD/SEK is going to continue higher.

Source: Tradingview, FOREX.COM
If DXY moves below 98.64, there is room for the US Dollar Index to run lower. If the correlation is to remain intact, USD/SEK would have to pull back into the flag formation (with a false breakout) and test the bottom trendline of the flag pattern near 9.8115.
Original from: www.forex.com
No Comments on “Is the USD/SEK – DXY Correlation Broken?”