Home / Forex news / USD/BRL Breaking Out

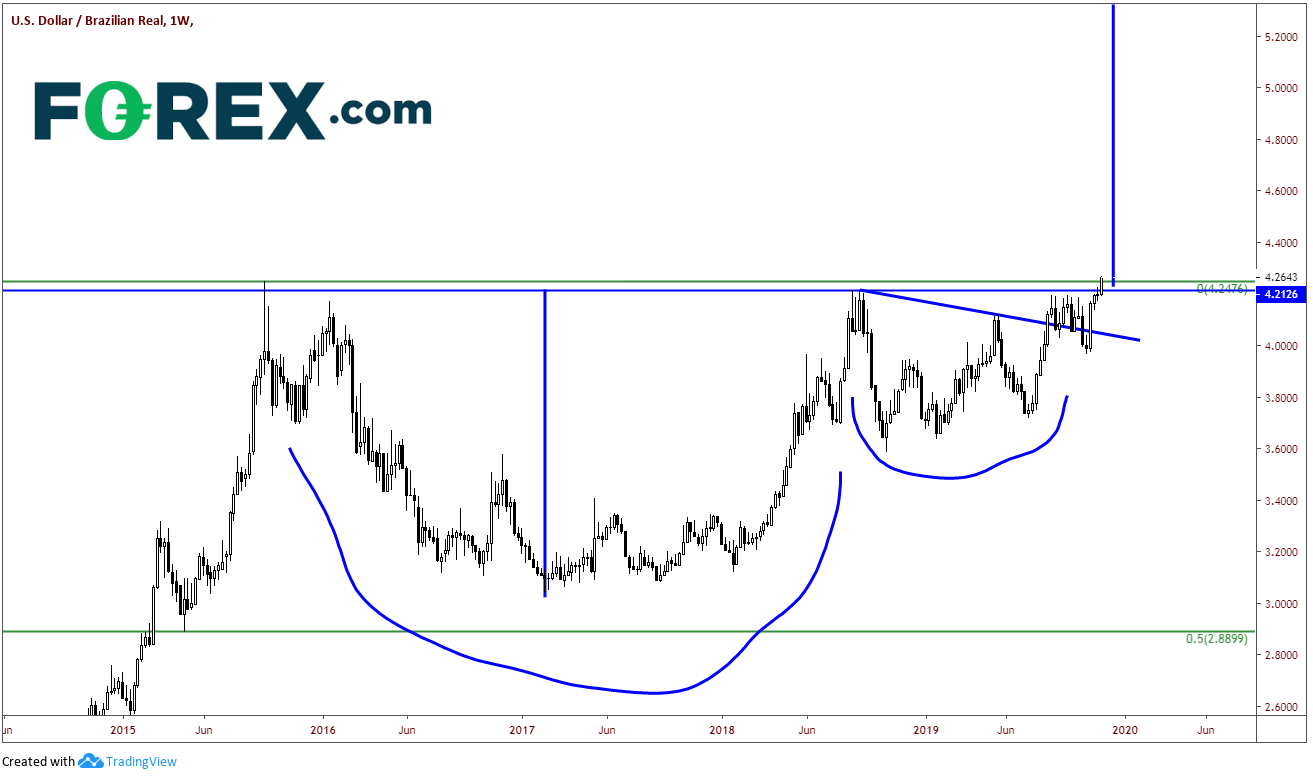
Back on October 21st, we took a look at the Chilean Peso and the Brazilian Real. We discussed how the protests in Chile were causing USD/CLP to move higher and how other US Dollar/Emerging Market currencies were moving higher as well. One EM currency pair in particular was the USD/BRL, which was forming a cup and handle formation on a weekly chart and was on the verge of breaking out. This may be the week it finally breaks out!
The high for the cup and handle in USD/BRL was 4.2126, however highs of 4.2476 from September 2015 needed to be taken out in order to push through the resistance and possibly accelerate the price move. On a weekly timeframe, a close above this level would signify a breakout of the cup and handle formation. The target for a cup and handle formation is the depth of the cup added to the breakout point of the handle. In this case, the target would be near 5.4000!

Source: Tradingview, FOREX.com
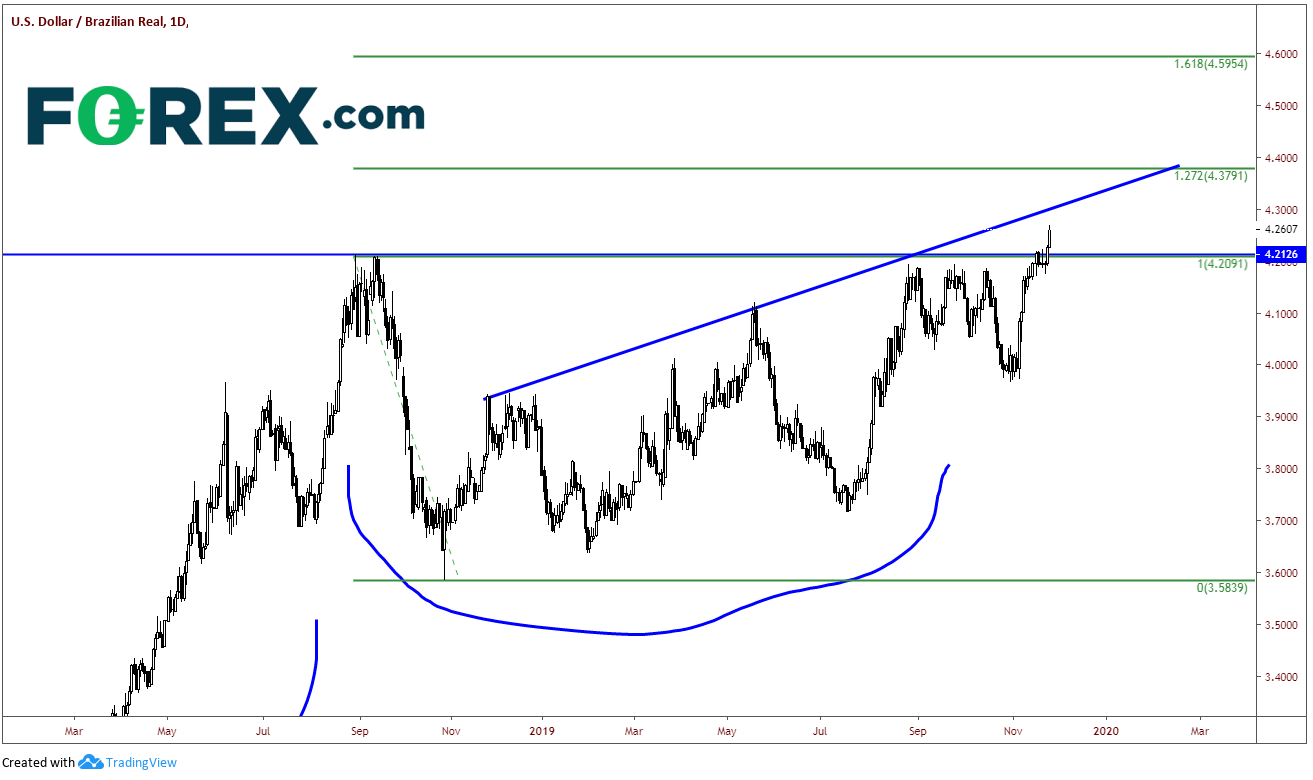
On a daily timeframe, USD/BRL actually broke through the triple top of the cup and handle formation on November 18th, however today was the first day it broke above the highs from 2015. If USD/BRL is to move to the target of 5.4000, it first has to get through trendline resistance near 4.3000 and the 127.2% Fibonacci extension from the highs on August 29th, 2018 to the lows October 30th 2018 at 4.3791. The final resistance is the 161.8% Fibonacci extension from the previously mentioned timeframe at 4.5954.

Source: Tradingview, FOREX.com
A band of support comes in between the recent triple top on the daily (before breaking higher) and the 2015 highs. These levels are between 4.1950 and 4.250. The next level below that is horizontal support from near recent lows near 4.0350.
Original from: www.forex.com
No Comments on “USD/BRL Breaking Out”