Home / Forex news / USD/CAD Still in Apex

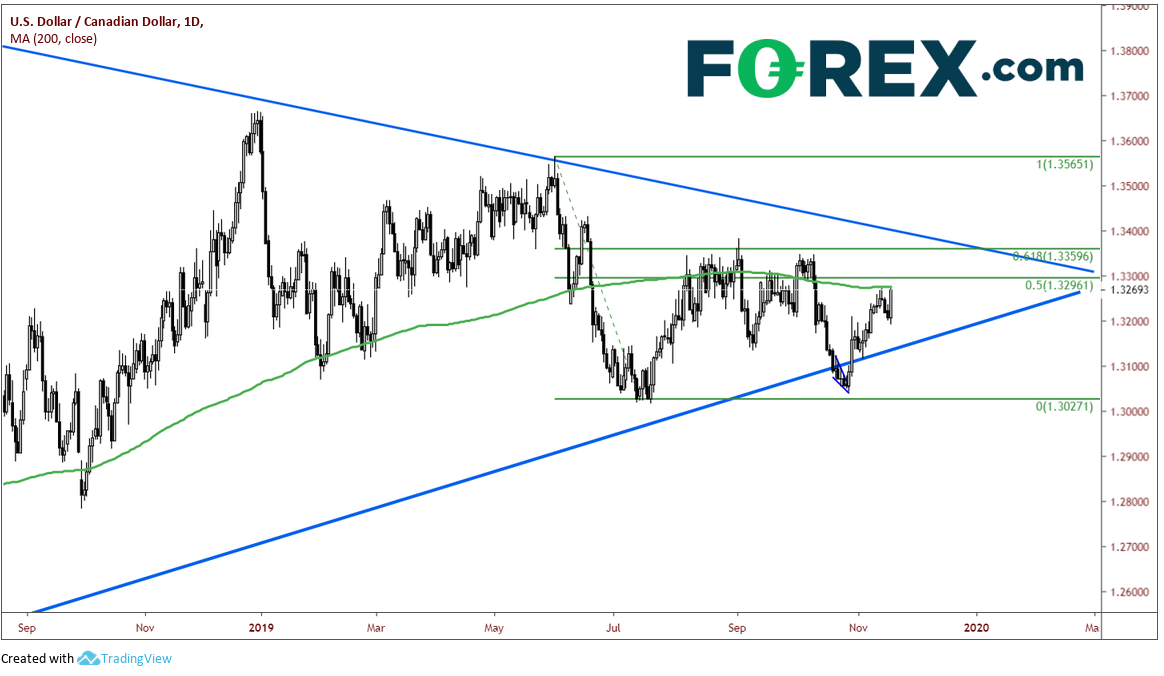
I feel like every time I look at USD/CAD the pair is reversing. The most likely reason I feel this way is because, as I have written before, it is chopping around within the apex of a long-term triangle dating back to early 2016. As a result, the pair is oscillating around the 200-day moving average and can’t seem to drift too far away from it!

Source: Tradingview, FOREX.com
There were two events that caused USD/CAD to go bid today. The first was that crude oil was down over -2.5%. The Canadian Dollar and crude oil generally have a positive correlation. Generally, when crude oil moves lower, so does the Canadian Dollar. In other words, when crude oil goes lower, USD/CAD will move higher. The other event that occurred today was that the Bank of Canada’s Wilkins spoke today and said although Canada’s economy and financial system are in a good place, they still have policy room to maneuver, as well as other options such as forward guidance, if need be. The comments are considered dovish, as the BOC has been on hold and has not mentioned any kind of maneuvering (if it needs to).
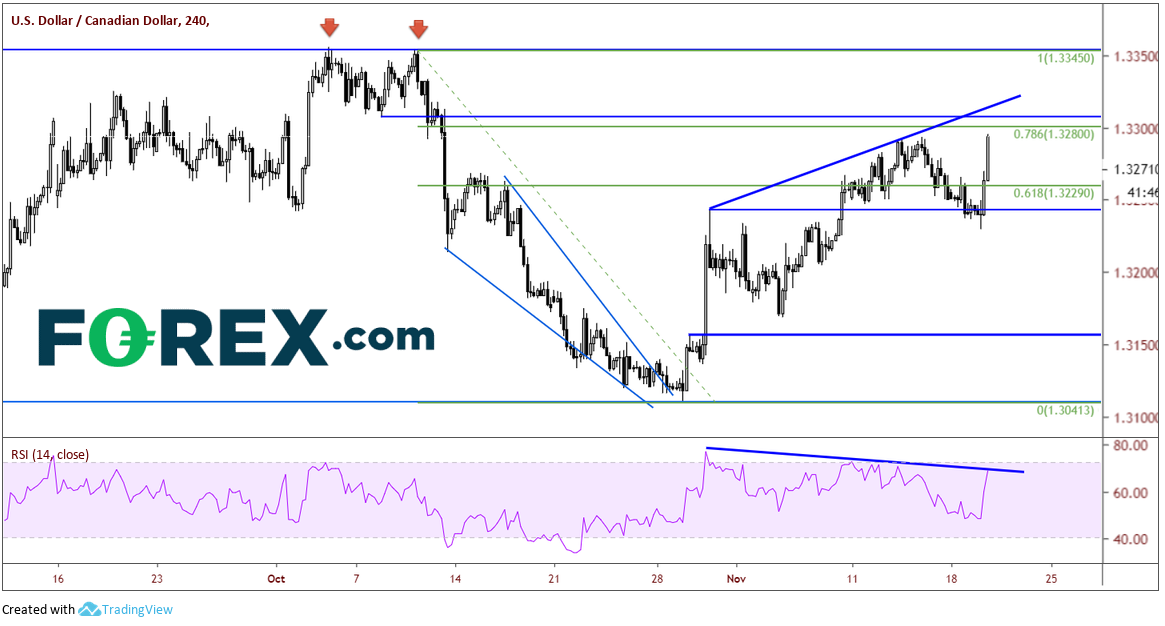
Although USD/CAD was up 0.5% today, there is strong resistance above (of course there is, price is in the apex of the triangle!) On a 240-minute chart, price in running into the 78.6% Fibonacci retracement level from the highs on October 10th to the lows on October 29th at 1.3280. There is also horizontal resistance above in the form of prior lows at 1.3290. Just above that is a rising trendline which crosses just below 1.3300. Take note of the higher highs in price and the lower highs in the RSI. Today’s price took out the prior high by 1.5 pips. Because there are 3 higher highs in price and 3 lower highs in the RSI, this is a strong warning from the market that prices may reverse. AND the 200-day moving average is at 1.3275.

Source: Tradingview, FOREX.com
If price does reverse, the rising trendline from the long-term symmetrical triangle crosses near 1.3140. If USD/CAD breaks through the trendline, it could retest prior lows near 1.3027.
Watch crude prices. If they continue to fall, USD/CAD may continue to go bid!
Original from: www.forex.com
No Comments on “USD/CAD Still in Apex”