Home / Forex news / USD/CHF getting Clobbered

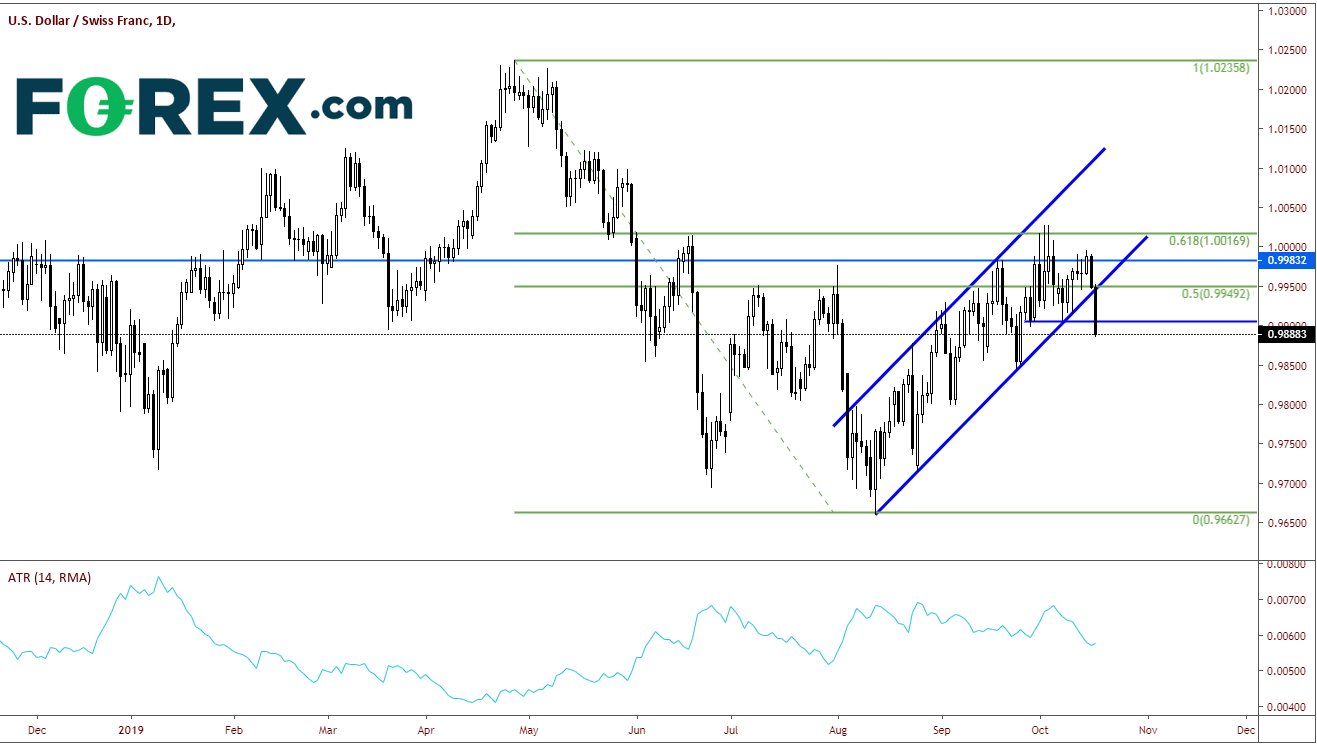
With all the talk of a Brexit deal getting done today, USD/CHF has quietly been getting hit today, down 0.5% and breaking down through some major support levels. Although the DXY got hit at the time the Brexit deal was announced, USD/CHF has been selling off since yesterday, where the pair failed to take out the all-important psychological 1.0000 level.
USD/CHF has been in an uptrend since putting in lows on August 13th. The pair retraced to the 61.8% Fibonacci level from the high on April 26th to the previously mentioned lows. However, it failed to close above those levels at 1.0017, and for that matter, the 1.0000 level as well. Today the pair not only broke through the bottom trendline of the rising channel at .9950, but also took out prior lows and horizontal support near .9900!

Source: Tradingview, FOREX.com
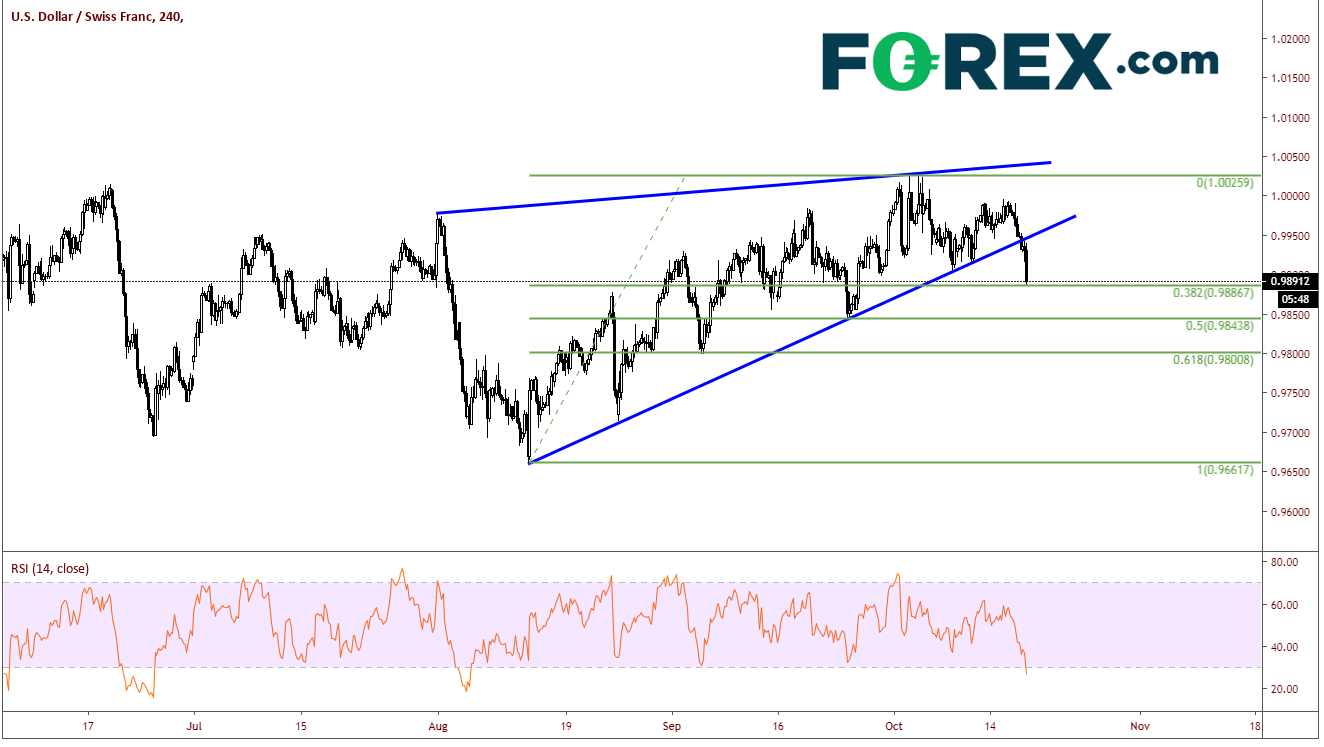
On a 240-minute time frame, USD/CHF has broken lower out of a rising wedge and, for the moment, has held the 38.2% retracement from the lows of August 13th to the highs from October 3rd at .9888. The target for a rising wedge is a 100% of the move higher, which is near .9660. Note that RSI is moving into oversold territory, however it is still pointing lower.

Source: Tradingview, FOREX.com
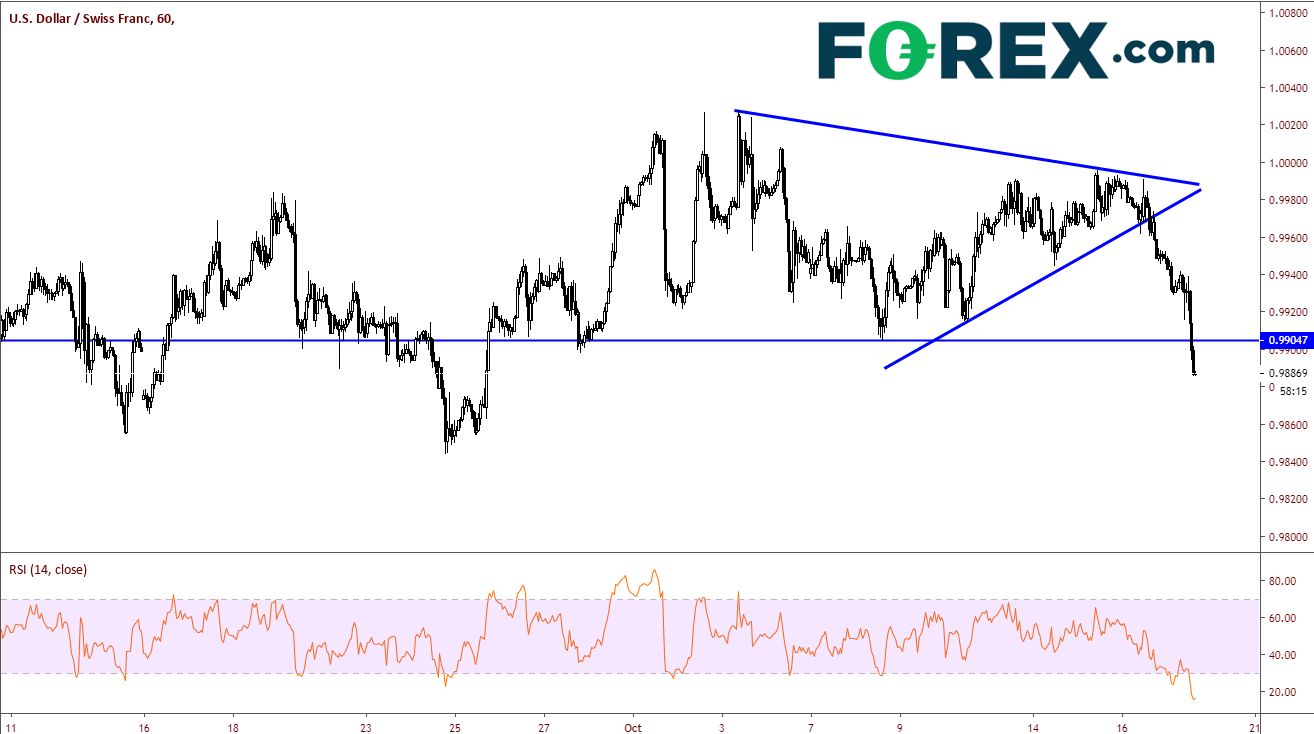
If we look at a short term 60-minute timeframe, USD/CHF took out the .9905 horizontal support, and the RSI is below 20. First resistance now comes in at that .9905 level. Above that, resistance comes in the rising trendline (on all timeframes) and horizontal resistance at .9960, and then the all-important psychological level of 1.0000. A close about that level may bring bulls back into the market. Next support level is the 50% retracement level from the 240-minute chart at .9844, which is also horizontal support.

Source: Tradingview, FOREX.com
Just as a reference, the Average True Range for USD/CHF on a daily timeframe is 57 pips. (see indicator at bottom of daily chart). This means that the pair trades in an average trading range (high to low) over the last 14 days of roughly 57 pips. Today’s range is 67 pips as of the time of this writing, and down 64 pips on the day. This indicates there may be a bounce in the short-term.
Original from: www.forex.com
No Comments on “USD/CHF getting Clobbered”