Home / Forex news / USD/CHF Signaling Risk On

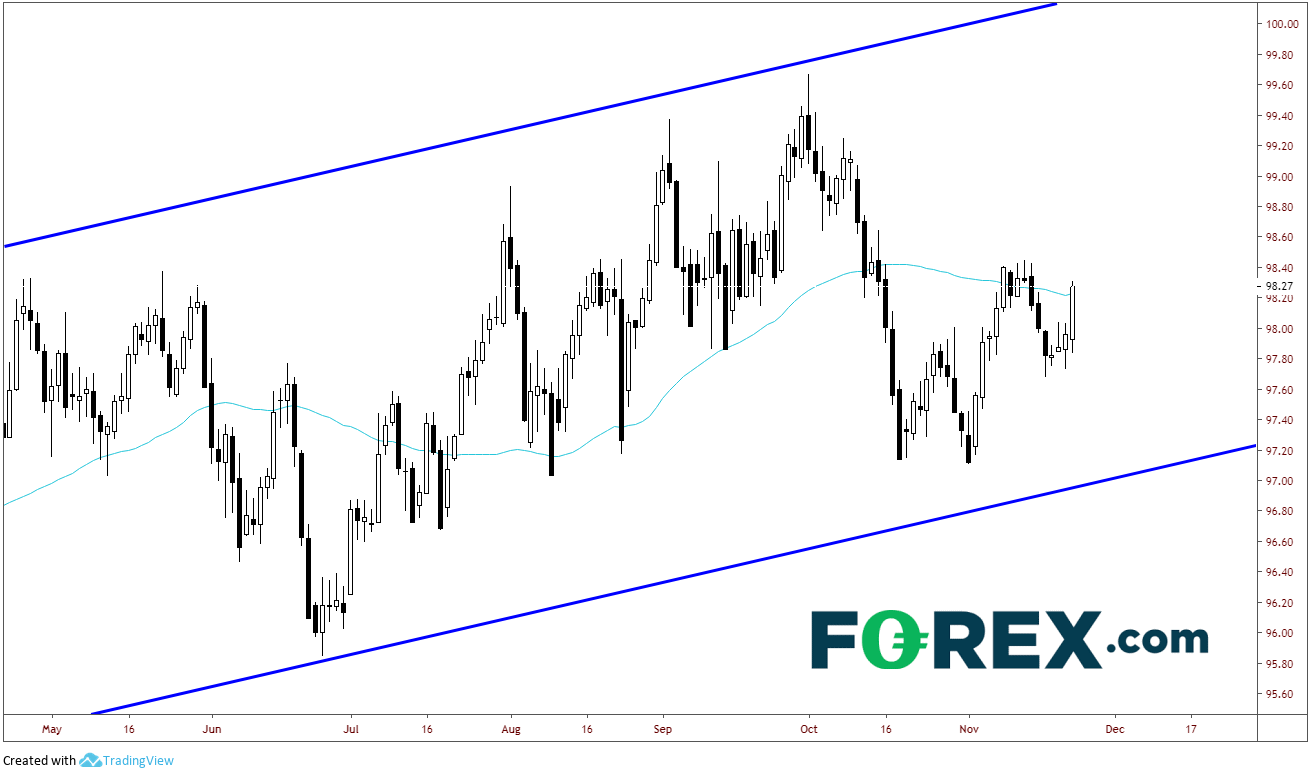
Today is Friday. As we have seen in recent weeks, US President Trump likes talk on the US-China “deal in progress” on Fridays. Today was no different, as Trump earlier said that the China trade deal is coming along very well. Stocks have heard it too many times before and the S&P 500 is trading in a tight trading range for the day. But is that the reason the DXY was bid all day? Perhaps it was the delayed reaction to the US data this morning?

Source: Tradingview, FOREX.com
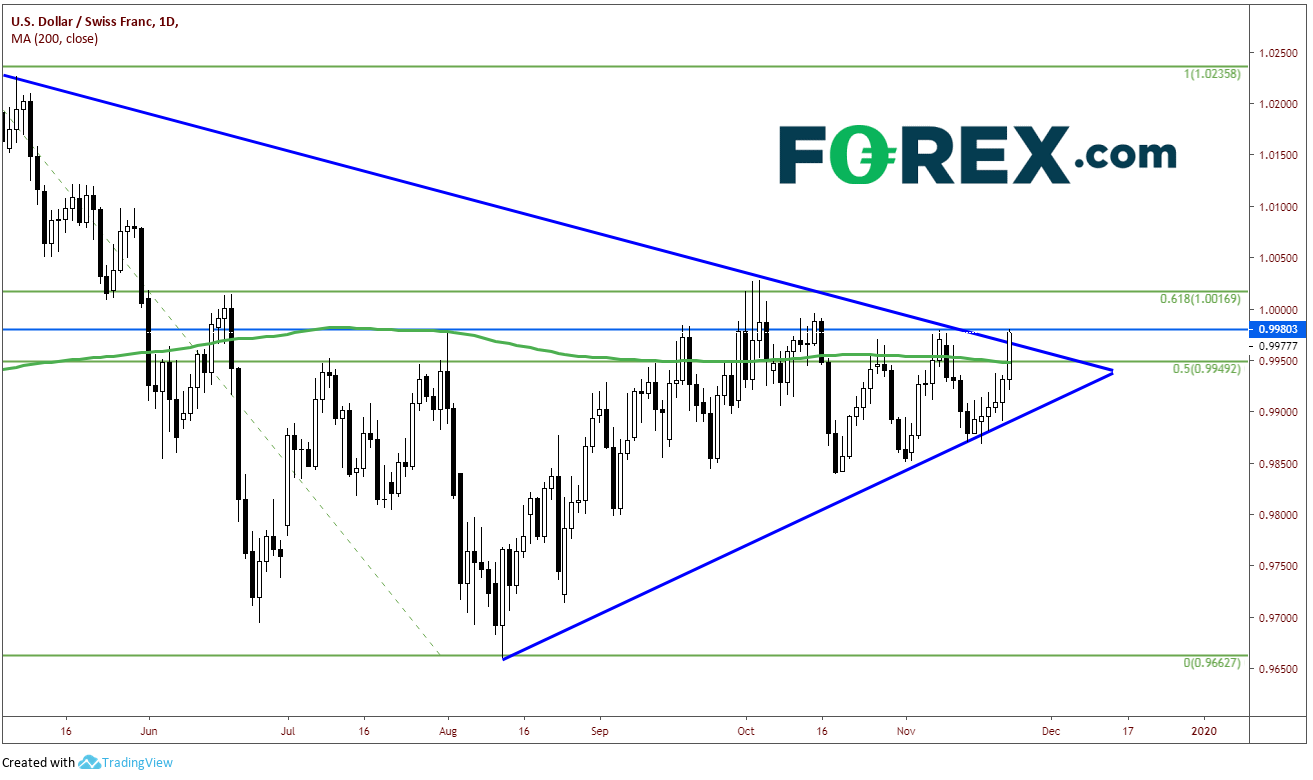
Regardless of the reason the move in DXY, USD/CHF is up nearly 0.5% on a day, whereas many other US Dollar pairs are trading in much tighter ranges. The USD/CHF is considered a directional indicator for the stock market. If USD/CHF moves higher, it is considered “risk on”. If the pair moves lower, it is considered “risk off”.
USD/CHF has been trading in a symmetrical triangle, as have other US Dollar pairs, since late April. As such, price has reached the apex and is coiling around the 200 Day Moving Average. However today is the sixth straight trading session that USD/CHF has closed higher. The pair busted through the 200 Day Moving Average closed above the descending trendline of the triangle for the first time at prior highs and horizontal resistance near .9980.

Source: Tradingview, FOREX.com
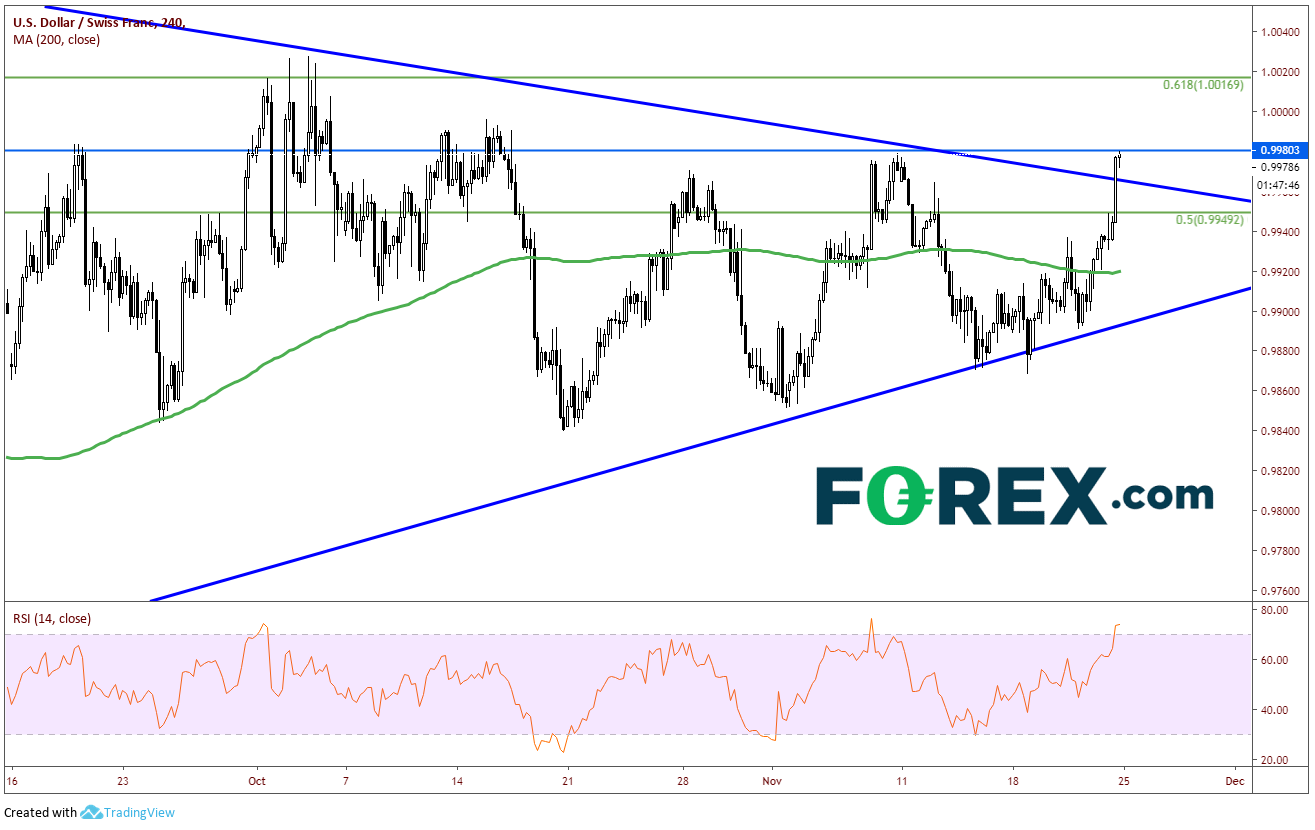
On a 240-minute chart, the RSI is in overbought conditions, and could be due for a pullback soon. .9950 is the 50% retracement level from the highs on April 25th to the lows on August 29th. This would be a nice area for price to pull back to as the RSI can unwind and USD/CHF can retest the trendline. The 200 Day Moving Average also comes in at that level. Below that, horizontal support comes in at .9820 and then the upward sloping trendline of the triangle near .9900. Resistance comes in at prior nears near the 61.8% retracement of the previously mentioned timeframe near 1.0017/1.0027. If USD/CHF trades above there, price can run as there is a lot of open space before horizontal resistance near 1.0130 (shown on daily).

Source: Tradingview, FOREX.com
Now that USD/CHF is showing risk on, the question is whether stocks will follow. Stocks are near all-time highs but have been quiet the last few days. Watch for news over the weekend and gaps on the reopen Monday morning. If stocks move higher, USD/CHF may continue its move back towards parity.
Original from: www.forex.com
No Comments on “USD/CHF Signaling Risk On”